Vertical Flight Efficiency During Climb and Descent
In addition to horizontal flight efficiency, various stakeholders have indicated to be interested in the vertical aspect of flight efficiency as well. The PRU have responded to this need by developing and testing performance indicators addressing vertical flight efficiency for possible use in the future.
The focus in this document is put on vertical flight efficiency during the climb and descent phases of flights rather than during the cruising phase.
During climb and descent, pilots are often faced with intermediate level-offs (Figure 1).
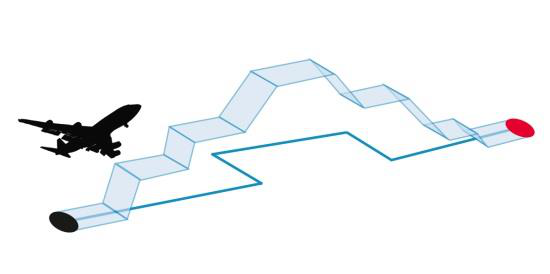
Figure 1: Typical vertical profile with intermediate level segments during climb and descent.
These level segments increase fuel burn since they generally take place at suboptimal altitudes. During descent the impact on fuel efficiency is generally higher because additional thrust has to be applied to fly level, while the lowest thrust setting could be used when a complete continuous descent would be available and flown by the pilot.
Hence, several studies and the reference material related to this topic (Larsson 2011; Performance Review Commission 2008; Canarslanlar et al. 2014; Airbus 2004) suggest that the benefit pool regarding fuel efficiency is larger for descents than for climbs.
Continuous climb operations (CCO) and continuous descent operations (CDO) are beneficial for the environment, in terms of fuel burn, the associated emissions and noise (Figure 2).
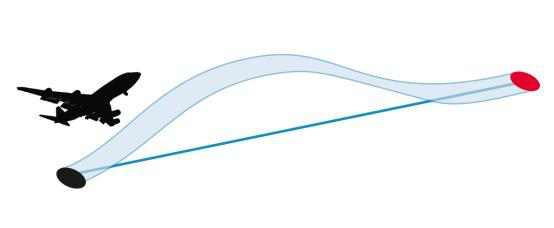
Figure 2: Smoother trajectory with continuous climb and descent.
The methodology presented here (see grey box) is very similar for the climb and descent phase so that the results for both phases are directly comparable.
The radius of 200NM around the airport is chosen because aircraft generally reach their cruising altitude within 200NM from take-off and the cruise level is also generally left within 200NM from the arrival airport. Another reason for this choice is to be able to distinguish the climb/descent phase of the flight from the cruise phase.
Additionally to the 200NM radius, a vertical limit is used based on the altitude put in the flight plan at 200NM from the airport. This altitude is used to be able to highlight inefficiencies which are introduced on a tactical basis. Obviously, these inefficiencies are not known to the airlines before they take off so the amount of fuel on board might not be the optimal amount.
Methodological notes
In the climb or descent parts of the trajectories the level segments are determined by calculating the rate of climb or descent (vertical velocity) between every pair of consecutive data points. If the rate of climb or descent between two data points is smaller than or equal to a chosen vertical velocity, that part of the trajectory is considered as a level flight segment. Doing this for the entire climb or descent trajectory, the distance and time flown level can be calculated.
Assumptions
The analysis is done for the part of the flight between the departure/arrival airport and the moment where either:
- the flight crosses the 200NM radius around the airport while it is below the altitude that is in the flight plan at that point; or
- the flight is inside the 200NM radius around the airport but crosses the altitude that is in the flight plan at the 200NM radius.
A segment of the trajectory is considered as level flight when its rate of climb or descent is lower than or equal to 300 feet per minute.
Level segments shorter than 0.5NM are not considered.
Case study
The practical use of the methodology is demonstrated in the following case study showing all flights from/to a specific European airport, based on a radar data sample for July 2015.
The following assumptions were made for the analysis:
Different runways in use are not distinguished by the analysis because this information is not available and the available data don’t allow determining it with a high degree of confidence.
The climb phase is considered to start at 3000 feet AGL since the Noise Abatement Departure Procedures (NADP) defined by ICAO end at this altitude (ICAO 2006).
The descent phase is considered to end at 1800 feet AGL because the interception altitude for ILS systems is generally above this altitude. Using 1800 feet AGL as lower limit allows capturing the level segments before ILS interception but disregards the trajectory below 1800 feet AGL where the aircraft are on the ILS glideslope and no level segments should occur.
Table 1 shows the numerical results of the analysis.
| Description | Climb | Descent |
|---|---|---|
| Average time flown level per flight | 14.1 s | 59.4 s |
| Average percentage of time flown level per flight | 1.2 % | 4.6 % |
| Average distance flown level per flight | 1.6 NM | 4.3 NM |
| Average percentage of distance flown level per flight | 1.5 % | 3.7 % |
| Median percentage of highest CCO/CDO altitude | 98.2 % | 94.4 % |
| Number of flights | 8518 | 8439 |
It is clear that much less level flight is detected during climb than during descent. This observation is the same for all major European airports.
As an example, the vertical trajectories during descent are plotted in blue in Figure 3 while the level segments are highlighted in red. It is clear that there are some vertical glitches present in the data but these will rather result in an underestimation of the amount of level flight.
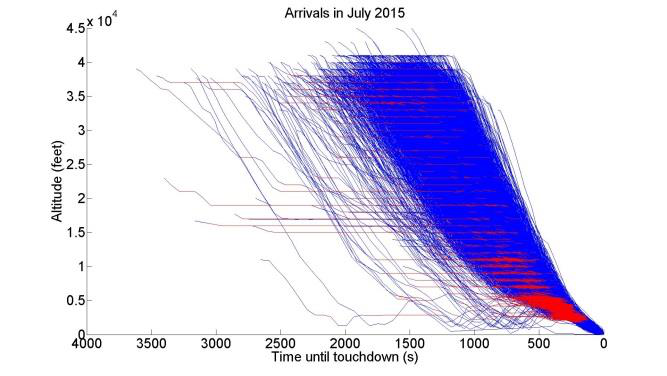
Figure 3: Vertical trajectories during descent.
It’s also interesting to evaluate the positions of level segments. Level segments of several flights around the same position suggest the presence of specific restrictions. Figure 4 shows the lateral view of the descent trajectories. Besides the level segments close to the airport, due to the vectoring and ILS procedures towards the runway, there is some level flight at higher altitudes as well. These level segments are most likely a result of constraints in handover procedures between neighbouring ANSPs, airspace restrictions or operational procedures which signals scope for future improvements.
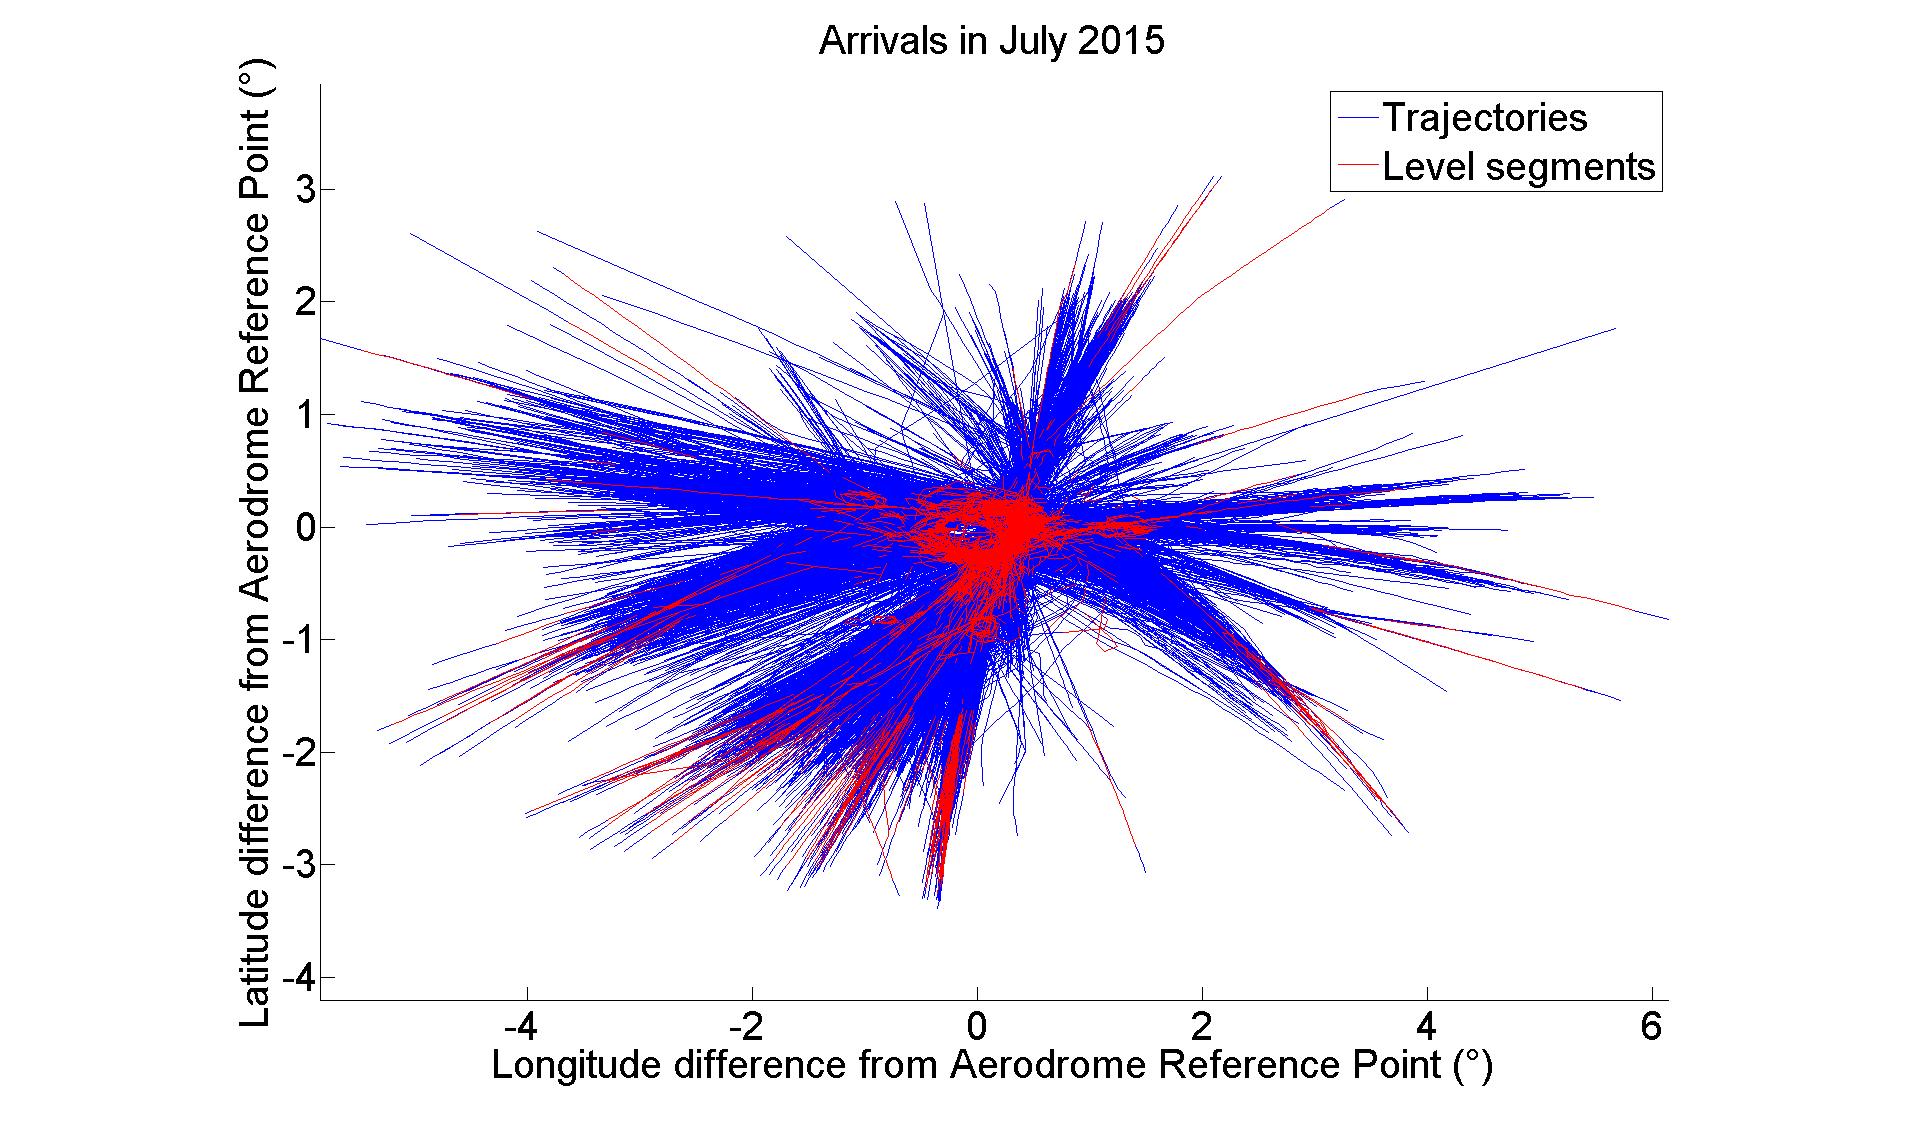
Figure 4: Lateral trajectories during descent.
Note
This study is available as a PRU Leaflet, see (Sam Peeters 2016) in the References section below.
A paper has been submitted to the 2016 ICNS Conference, see (S. Peeters et al. 2016) in the References section below.